



Scenario Analysis
In regard to physical risks, dependencies, and impacts related to climate and nature, assessment of the geographic locations of our global subsidiaries are conducted using data from government and international sources. These include Taiwan’s Water Resources Agency flood risk data and the Aqueduct Water Risk Atlas developed by the World Resources Institute (WRI). These tools help identify potential physical risks under various scenarios such as water stress, flooding, landslides, and debris flows, providing essential information for subsequent risk and opportunity analyses and strategy development.
Physical Risk Analysis of ASEH Global Sites
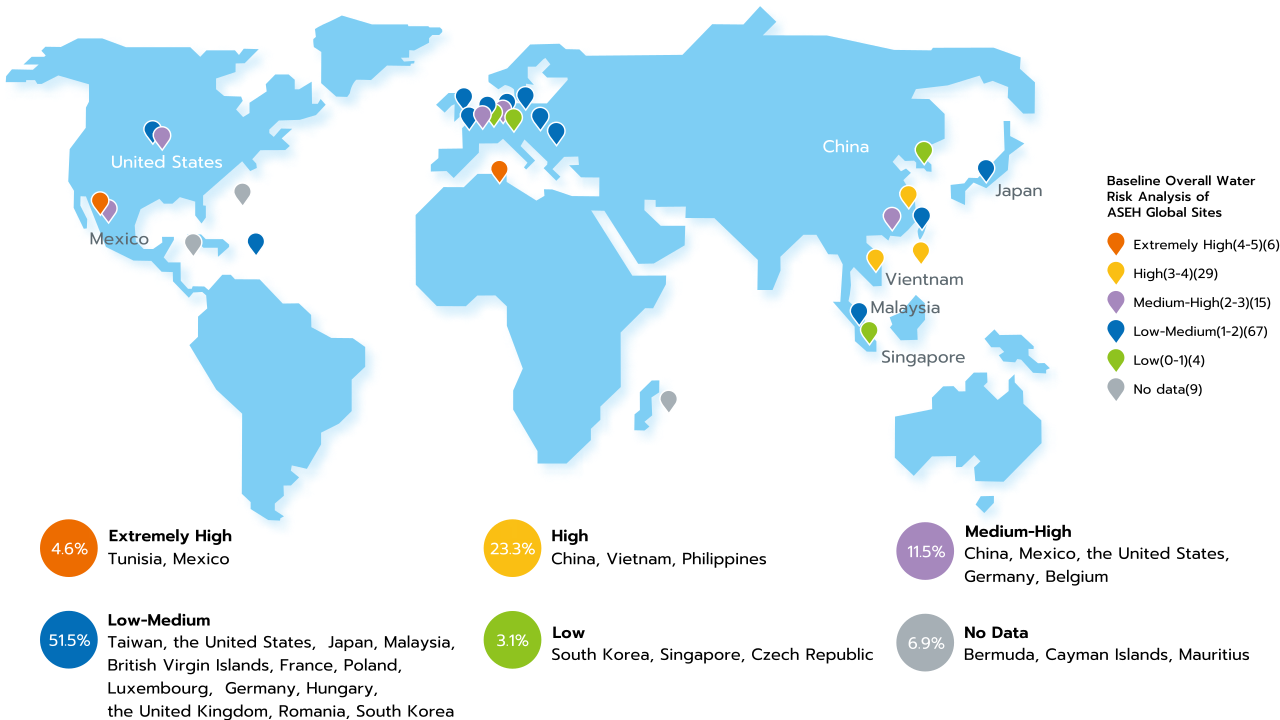
ASEH adopts the Aqueduct indicators established by the World Resources Institute (WRI) to conduct water risk analysis. We analyzed a total of 110 facilities worldwide in Taiwan, China, Hong Kong, Japan, South Korea, Malaysia, Singapore, Vietnam, Philippines and other Asian countries, as well as America (such as the United States, Mexico, etc.), Europe (Belgium, France, Poland, Germany, the United Kingdom, the Czech Republic, etc.) and Africa (Mauritius, Tunisia) and other regions.
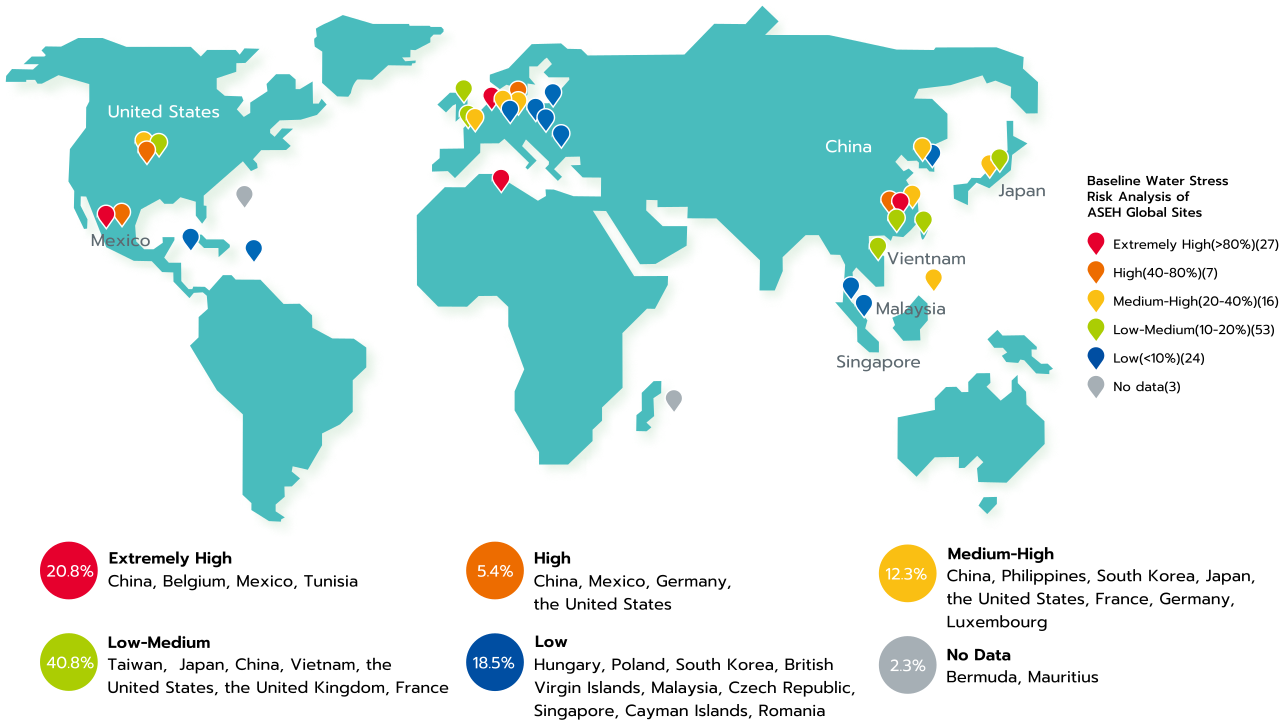
ASEH adopts the Aqueduct indicators established by the World Resources Institute (WRI) to conduct water risk analysis. We analyzed a total of 110 facilities worldwide in Taiwan, China, Hong Kong, Japan, South Korea, Malaysia, Singapore, Vietnam, Philippines and other Asian countries, as well as America (such as the United States, Mexico, etc.), Europe (Belgium, France, Poland, Germany, the United Kingdom, the Czech Republic, etc.) and Africa (Mauritius, Tunisia) and other regions.
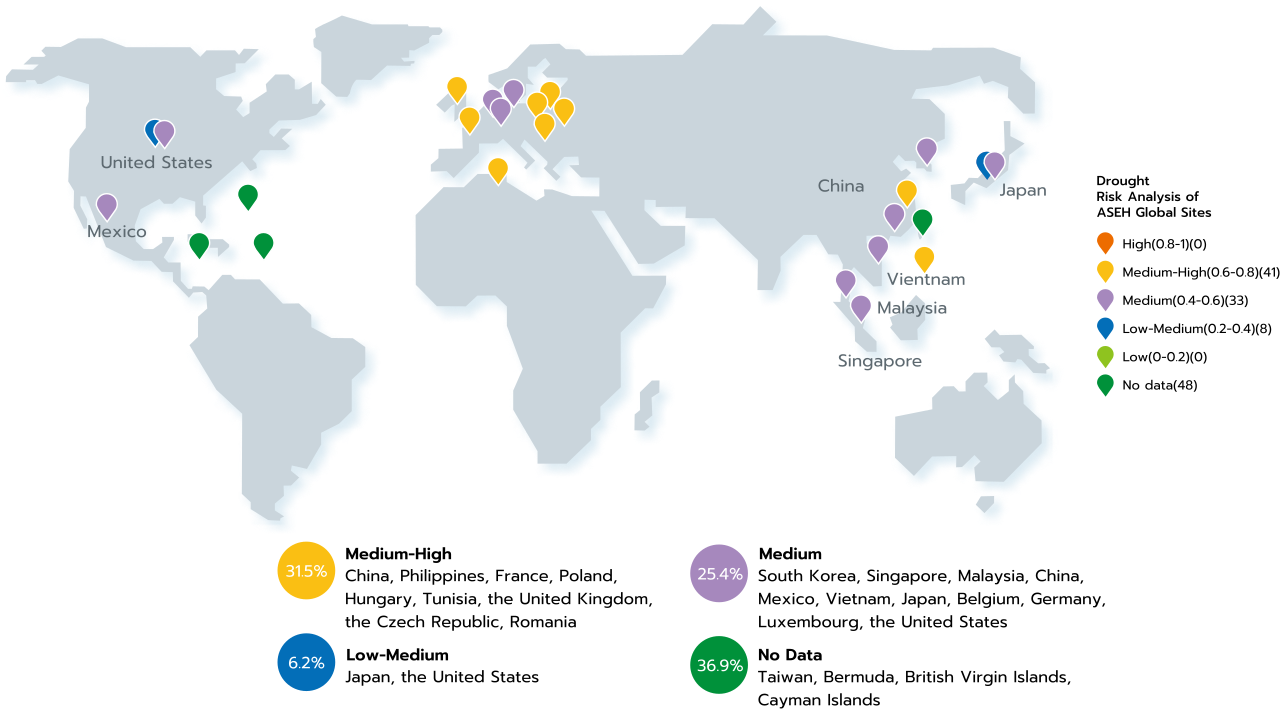
For the drought risk assessment, ASEH analyzed a total of 110 global sites using a composite indicator that integrates the likelihood of drought occurrence, the exposure of populations and assets, and the vulnerability of those populations and assets to the adverse impacts of drought.
Physical Risk Analysis of ASEH Taiwan Sites
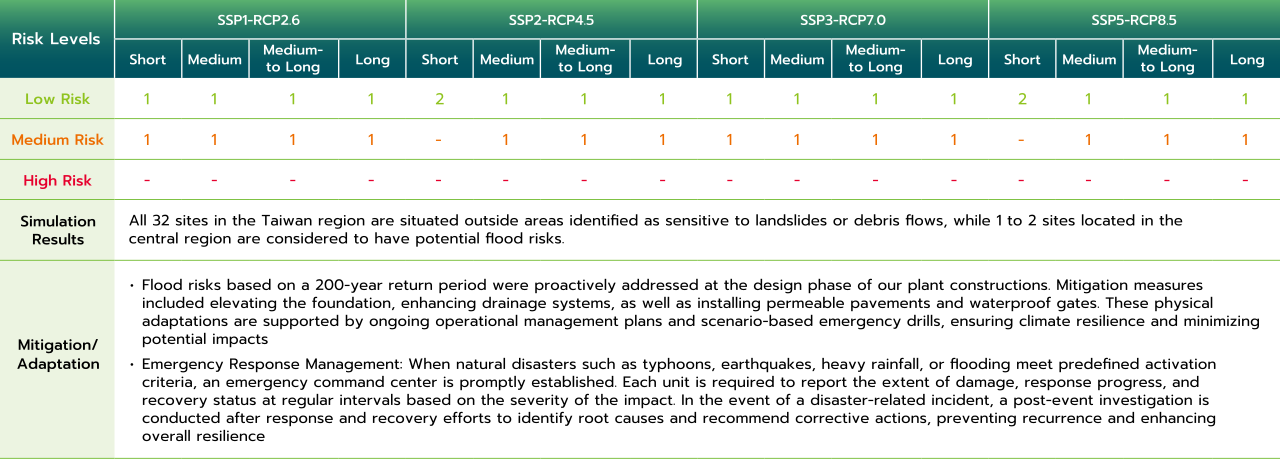
ASEH considers the potential impacts of climate change-induced extreme rainfall events and applies the IPCC framework of Hazard × Vulnerability × Exposure to conduct physical climate risk assessments. Hazard is evaluated based on multiple Shared Socioeconomic Pathways (SSPs) and Representative Concentration Pathways (RCPs), including SSP1-RCP2.6, SSP2-RCP4.5, SSP3-RCP7.0, and SSP5-RCP8.5. These scenarios are simulated across different time horizons, and the resulting risks are categorized into three levels for risk management purposes.
In the assessment, extreme rainfall under climate change scenarios is defined as the hazard, while the resulting impacts, including flooding, landslides, and debris flows, represent vulnerability. The geographical locations of operational sites are considered as exposure factors. A quantitative physical risk analysis is then conducted for each site to evaluate climate-related physical risks.
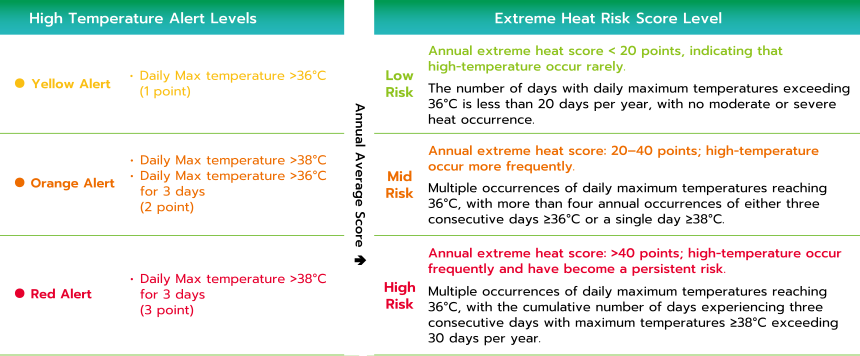
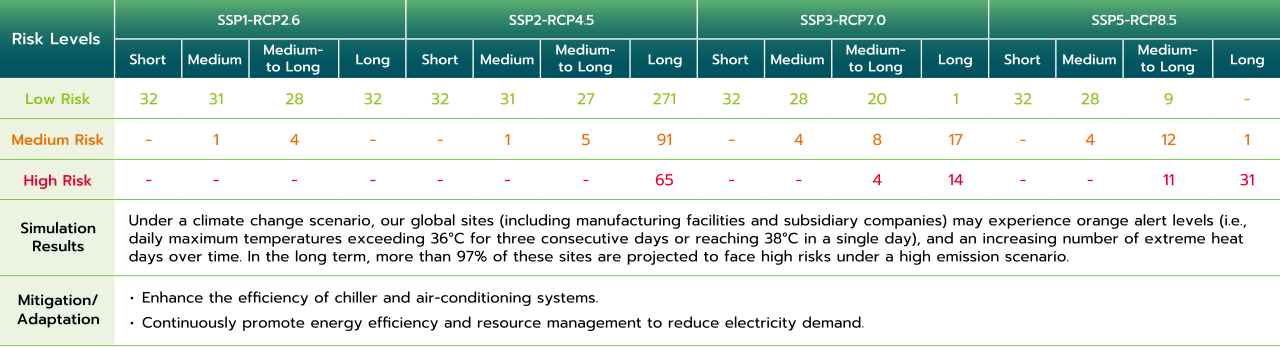
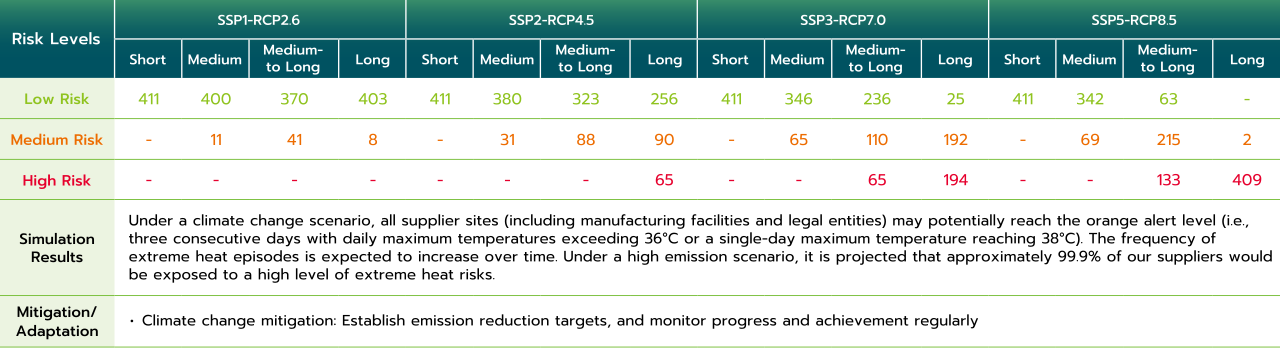
This year, we conducted a comprehensive assessment of the potential risks associated with extreme heat arising from climate change. Extreme heat at each of our facilities was analyzed based on the severity of extreme heat, with the level of exposure based on the respective geographical locations.
The assessment was conducted in accordance with the Central Weather Administration's extreme heat information network, whereby extreme heat is classified into alert levels of yellow, orange and red, and assigned scores ranging from 1 to 3 based on the maximum temperature and the duration. We closely monitor the frequency of extreme heat occurring throughout the year at our respective facilities, recording and classifying them into risk levels from low, medium to high.
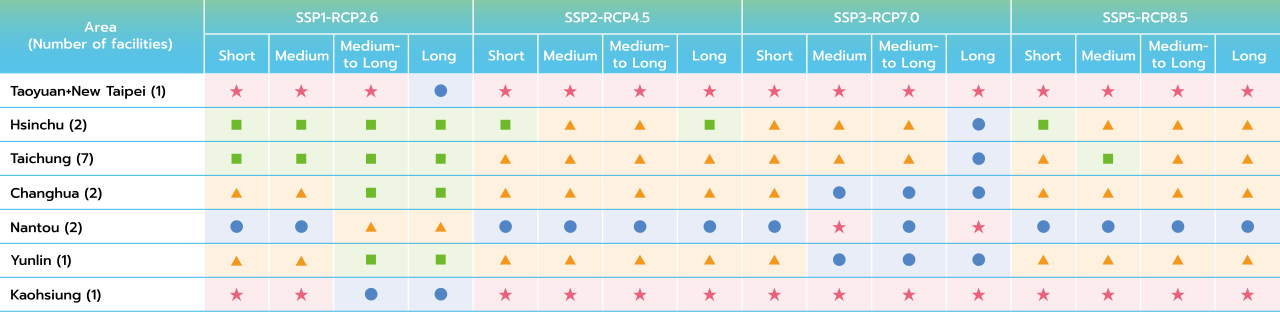
As most of ASEH facilities are located in Taiwan, it is crucial to closely monitor water scarcity risk in the region. We have divided our Taiwan facilities into 20 areas based on the supplying water reservoirs by referencing the local government database, before assessing the historical frequency of water scarcity events at each reservoir and the frequency of water scarcity risks under different climate change scenarios.
We analyze the historical frequency of water scarcity events and the probability of water scarcity from different climate change scenarios at each facility‘s water supply sources. According to the analysis results, the historical frequency of water scarcity events is lower in Taipei, New Taipei City, Hsinchu, Taichung, and Changhua areas, followed by Nantou areas, and higher in the Kaohsiung and Taoyuan area.
We assess the water scarcity risk at each Taiwan facility under each scenario using a combination of historical observations and the water scarcity probability, and
water scarcity riskmeasurement matrices under different scenarios: High-risk facilities will be given priority attention and adaptation measures such as continuously enhancing water efficiency, adding water storage facilities, and establishing emergency backup water sources will be implemented to address drought risks and water shortages. Identification, analysis and putting in place appropriate response plans enable us to bolster the resilience of our operations across different scenarios.
Water scarcity risks of the Taiwan facilities under various scenarios

Water scarcity risks of the Taiwan facilities under various scenarios
Transition Risk and Financial Impact Analysis
Assessment Framework for the Climate-Related Transition Risks
We began by classifying the boundaries of our operations into Taiwan, China and overseas sites. Climate transition risks including regulatory, market, technological, and reputational factors are assessed according to the International Financial Reporting Standards (IFRS) S2 transition scenario guidelines. Based on the assumption of continuous business growth, we determined that the financial impacts of different transition scenarios are aligned with temperature pathways below 2°C and even 1.5°C. This includes comparing the financial implications of a Business as Usual (BAU) approach versus the RE100 strategy, as well as the management costs required to meet external pressures. We also estimate the potential financial outcomes of strategies already implemented or planned and compare them to the projected costs of achieving net-zero targets, identifying any gaps between the two.
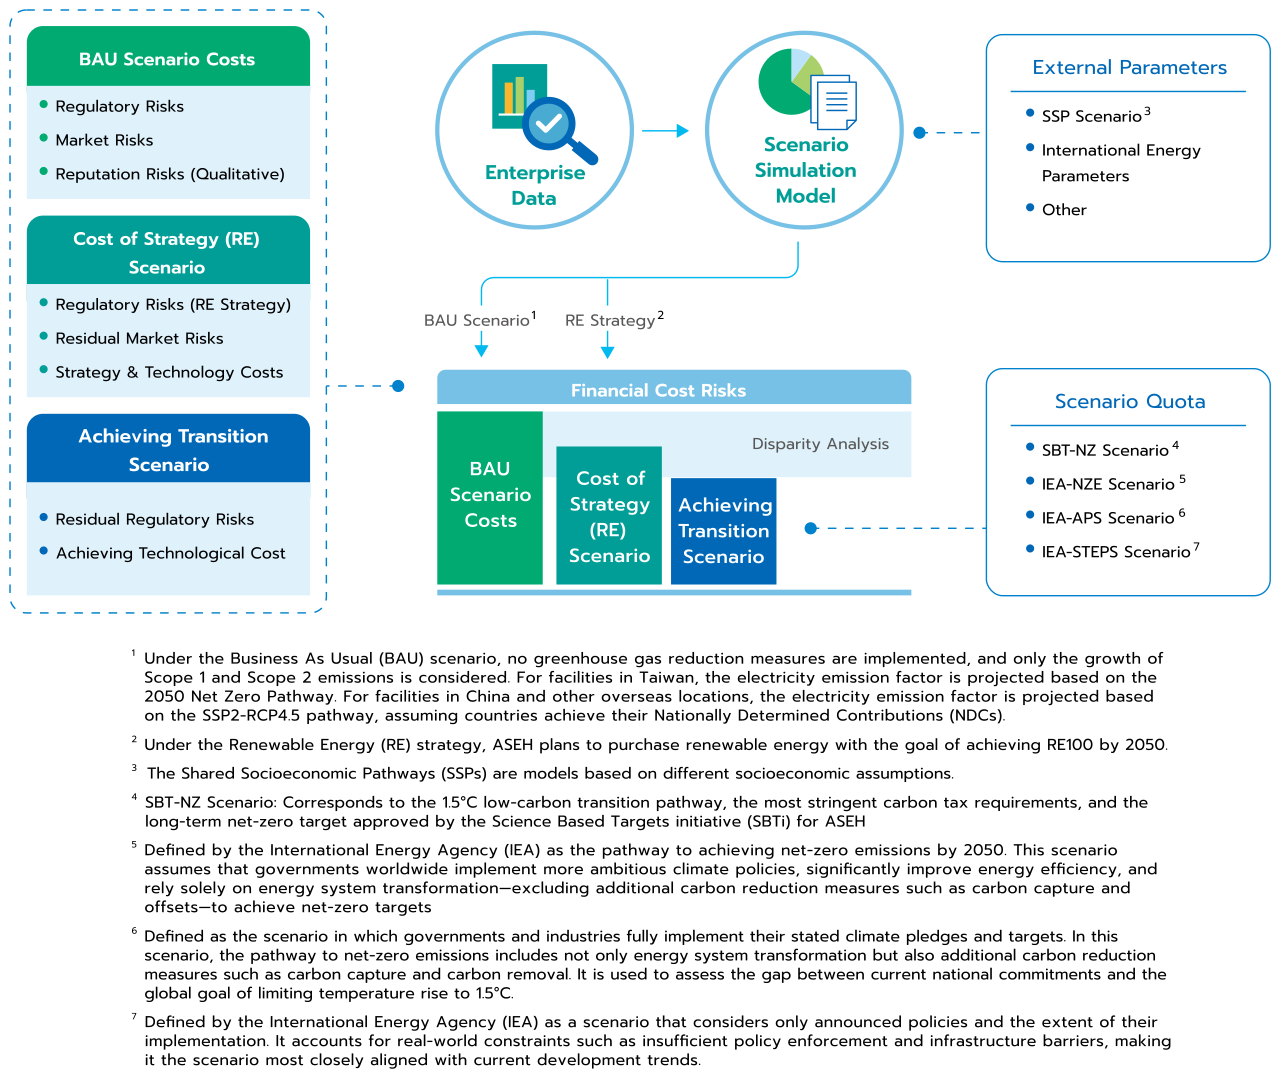
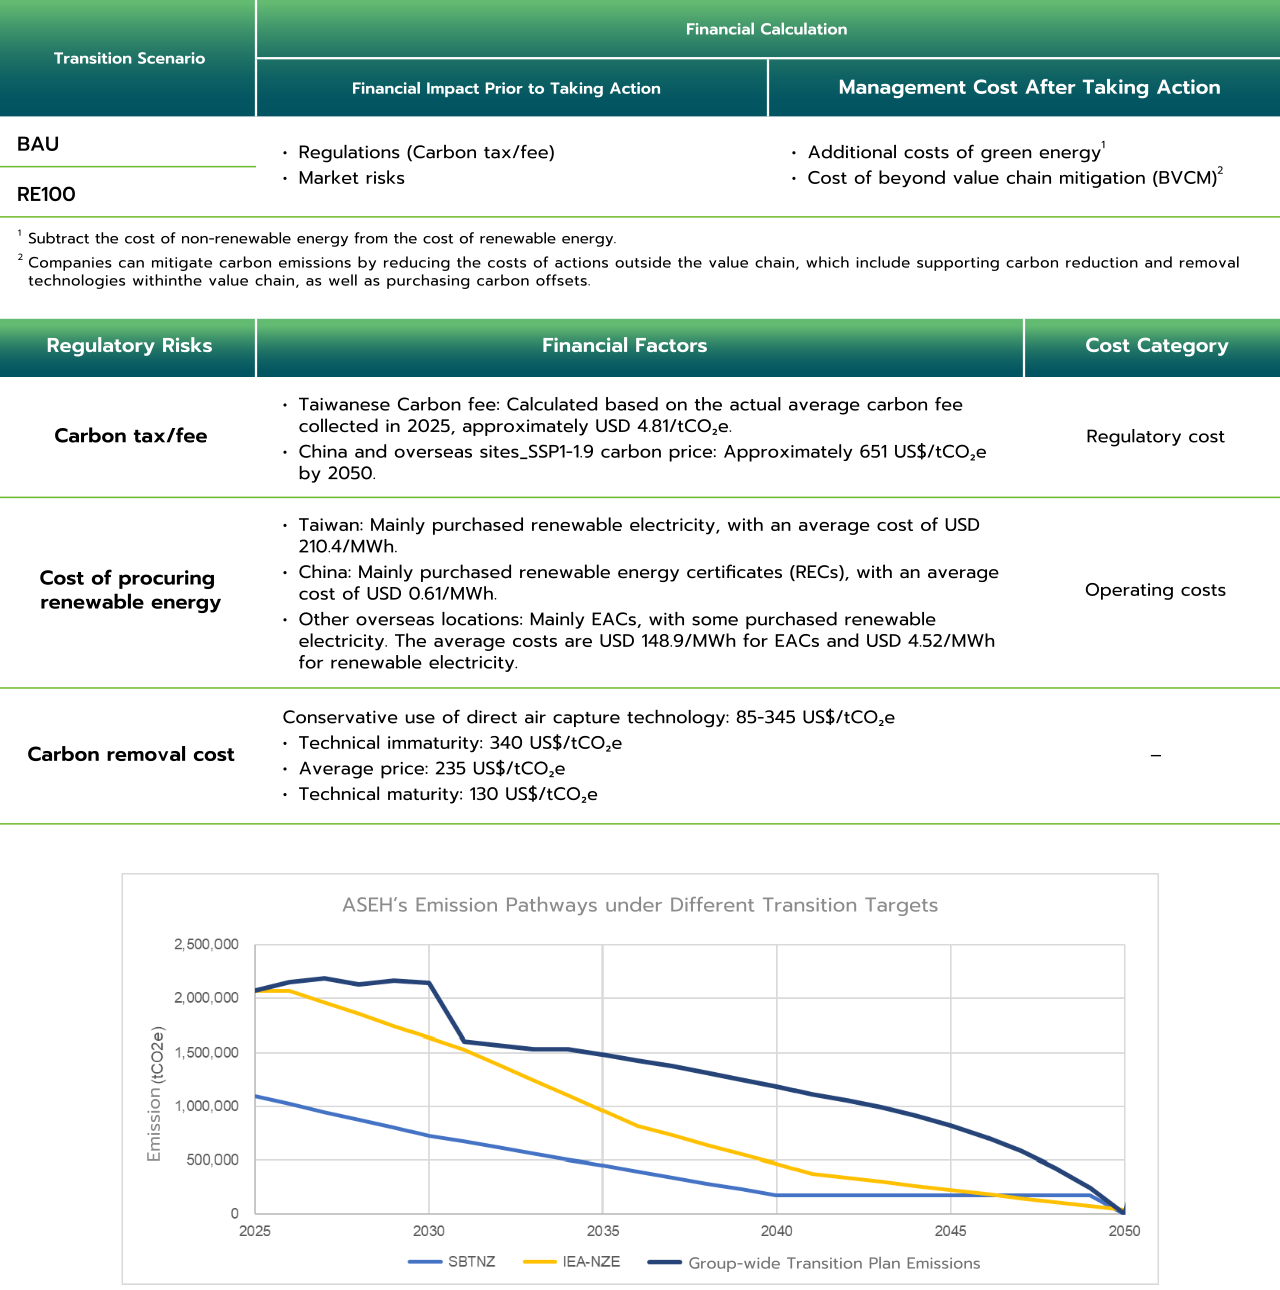
Under the RE100 strategy, ASEH is expected to meet the transition targets outlined in both the IEA Announced Pledges Scenario (APS) and the IEA Stated Policies Scenario (STEPS). The SBT reduction pathway aims for an annual emissions reduction of 4.2%, with final residual emissions projected to reach approximately 10% by around 2038.
After 2030, emissions are expected to decline significantly as the renewable energy procurement ratio continues to increase. However, due to the company’s continued rapid expansion, renewable energy procurement cannot keep pace with the growth in electricity consumption and Scope 1 emissions. While a significant gap to the target remains, overall emissions continue to decline. By 2050, ASEH is expected to achieve the RE100 target; however, Scope 1 emissions will still remain.
By 2050, residual emissions are projected to approach the final residual emissions threshold defined by the SBTi Net-Zero Standard. The remaining emissions are expected to be neutralized through carbon removal credits or other innovative technologies to achieve the net-zero emissions target.
Carbon tax risk assessments are conducted from both regional and global perspectives. At the regional level, the analysis draws on local government policies to assess the resilience of transition strategies in each area:
Based on Taiwan’s carbon fee regulations, an actual average carbon price of USD 4.81/tCO₂e collected in 2025 is applied, with a threshold of 25,000 tCO₂e annual emissions for
estimation.Most of our facilities in China and overseas lack clearly defined carbon fee/tax regulations. Therefore, the strictest carbon pricing system is used for estimation.
At the global level, the assessment focuses on the gap between ASEH’s overall transition strategy and the company’s net-zero targets. The SBTi Net-Zero Target (SBT-NZ) is used as benchmark thresholds. The analysis also assumes potential carbon tax risks if targets are not met, applying the strictest carbon price conditions for estimation.
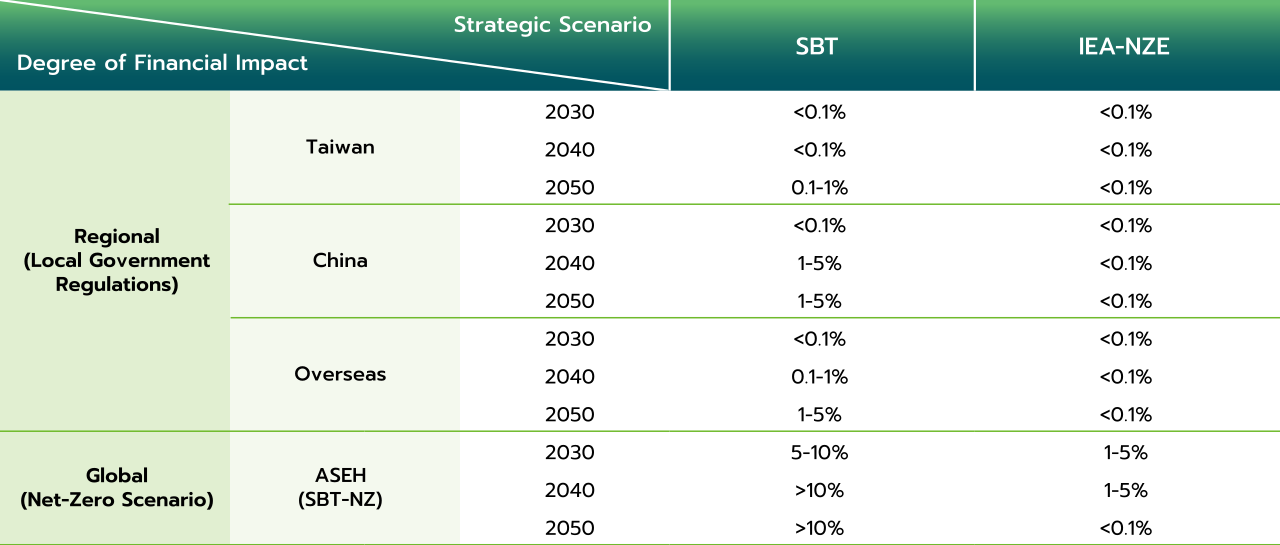
Regional Level: The results show that under the no-action scenario, the financial impact of carbon pricing in Taiwan is relatively low – at less than 0.1% of revenue, due to the lower carbon fee rate compared to the SSP1-1.9 scenario. In contrast, we face a higher carbon tax impact in China due to a larger number of facilities and the use of a stricter carbon pricing scenario. Under the transition strategy, the adoption of low-carbon energy significantly reduces Scope 1 & 2 emissions, thereby lowering the carbon tax risk substantially.
Global Level: Under the BAU scenario, carbon tax/fee risks are relatively high due to the application of the most stringent carbon pricing assumptions. As renewable energy adoption increases, Scope 2 emissions will decline significantly, shifting future carbon fee costs mainly toward residual Scope 1 emissions. Overall, transition strategies substantially reduce carbon fee exposure compared with the BAU scenario.
Under the SBT-NZ target scenario, emissions are reduced by an average of 4.2% annually in accordance with the target pathway. Carbon fee expenditures are mainly concentrated in the early stage and are expected to peak around 2040. As renewable energy adoption continues to increase and emissions gradually decline, carbon fee expenditures are expected to decrease year by year. By 2050, after achieving the RE100 target, only final residual emissions will remain, which are planned to be neutralized through carbon removal credits or other mature negative emissions technologies to achieve net zero.
Failure to meet our customers’ low-carbon requirements may result in revenue loss. The market risk assessment is conducted under the most stringent scenario, taking into account the net-zero target achievement rate, production value, potential revenue loss due to decarbonization requirements, and the proportion of affected customers. The affected production value refers to products or customers with decarbonization requirements; failure to meet these requirements could result in the loss of a significant portion of revenue and market
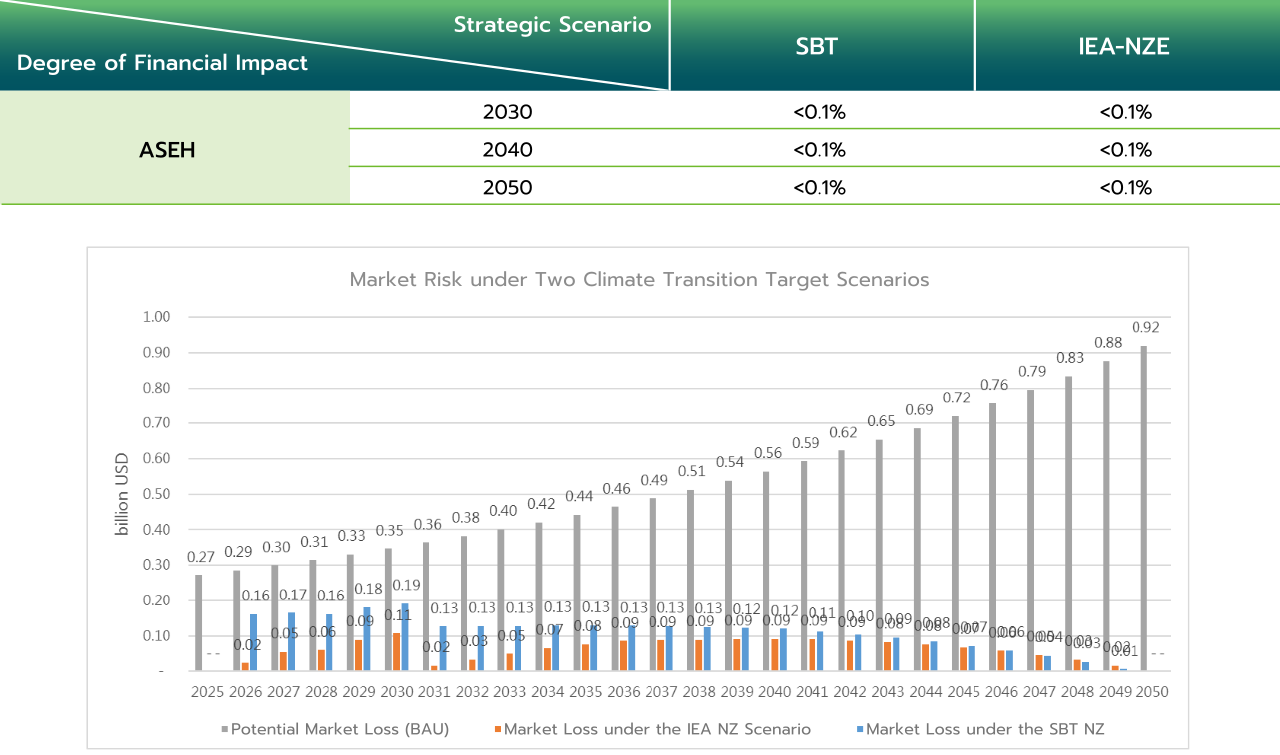
Under the current renewable energy transition strategy, market risk remains relatively high during 2025–2030 due to the significant gap in achieving the SBT-NZ target. However, as renewable energy transition progresses and the gap between emissions and the global net-zero pathway narrows, overall risk is expected to gradually decline from 2038 onward and be eliminated by 2050. Under the existing transition plan, the alignment with the IEA NZE target is approximately 31% or lower. Nevertheless, as ASEH continues to advance renewable energy transition, the overall market risk impact remains lower than that under the BAU scenario.
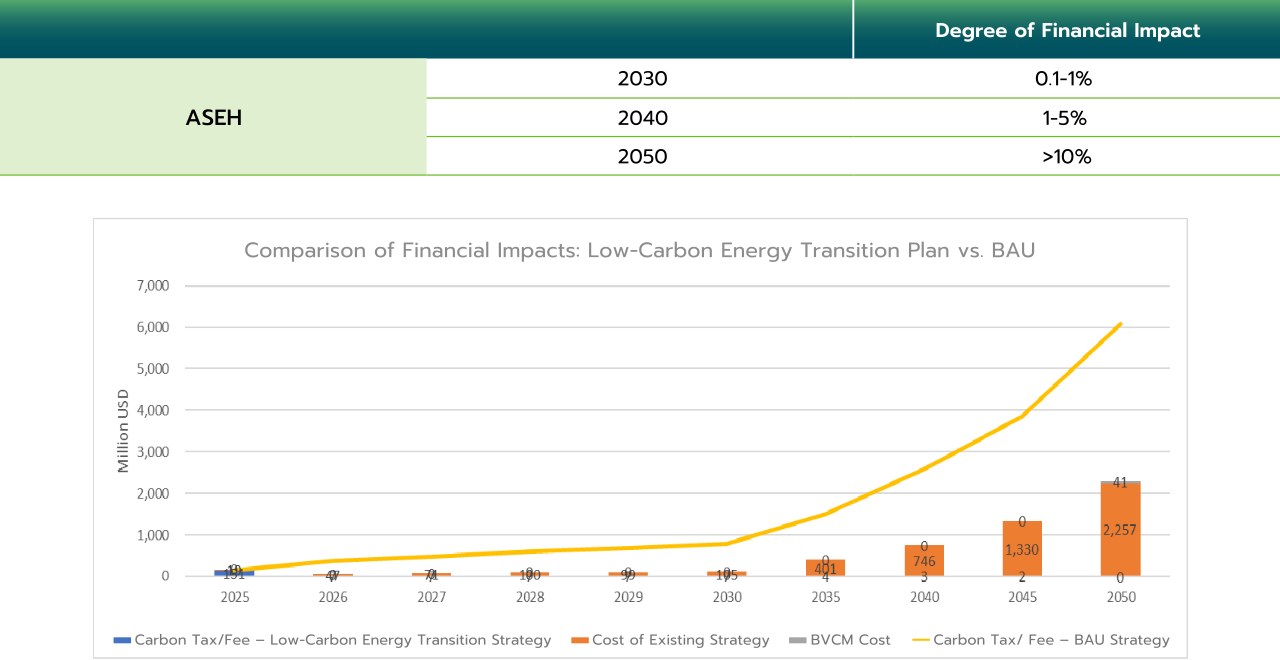
Prior to achieving the net-zero target, our primary management costs stem from carbon taxes/fees. After 2040, the main cost will shift towards renewable energy procurement as the use of renewable energy increases. According to SBT-NZ standards, companies that reduce emissions by 90% or more by 2050 are allowed to use carbon removal or storage technologies to offset residual emissions that cannot be eliminated. Since Scope 2 emissions can be reduced through the transition to low-carbon energy, carbon removal technologies are expected to be prioritized for offsetting Scope 1 emissions. BVCM costs are estimated based on an average carbon removal price of USD235/tCO₂e, resulting in an expected expenditure of approximately USD40.9 million by 2050.
Based on the outcomes of the above 2 scenarios, a low-carbon energy transition strategy results in significantly lower financial impact compared to BAU scenario. At ASEH, we have defined distinct short-, medium-, and long-term renewable energy targets. Using 2016 as the baseline, our goal is to increase the renewable energy share by 3% annually, reaching RE25 by 2025, RE72 by 2040, and RE100 by 2050. For our facilities in China and overseas, the medium-term goal is RE100. We will exercise some degree of flexibility on the RE targets for facilities in Taiwan, adjusting them in phases and implementing renewable energy procurement plans based on market supply conditions accordingly.
Physical Risk Analysis of Global Supplier Sites
ASEH adopts the Aqueduct indicators established by the World Resources Institute (WRI) to conduct water risk analysis. We analyzed a total of 1025 suppliers worldwide in Taiwan, China, Hong Kong, Japan, South Korea, Malaysia, Singapore, Vietnam, Philippines and other Asian countries, as well as America (such as the United States, Mexico, etc.), Europe (Belgium, France, Poland, Germany, the United Kingdom, Switzerland, the Czech Republic, etc.), Australia(New Zealand) and Africa (Seychelles) and other regions.
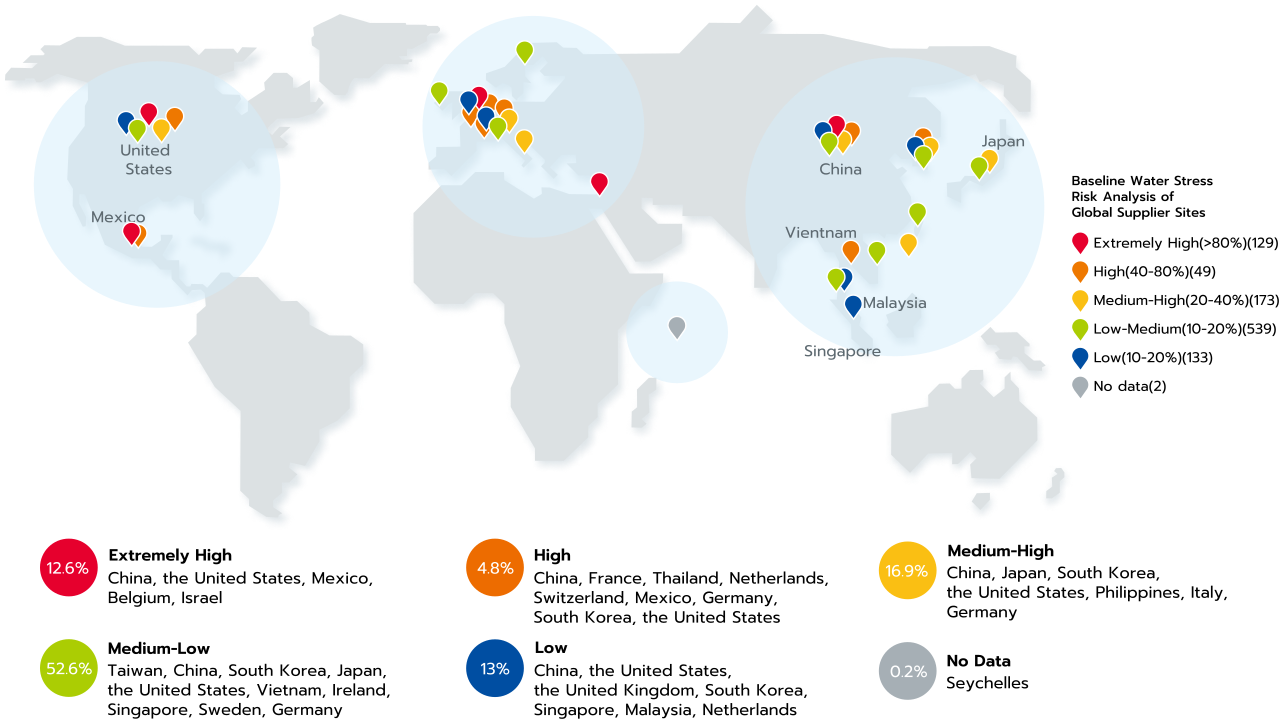
ASEH adopts the Aqueduct indicators established by the World Resources Institute (WRI) to conduct water risk analysis. We analyzed a total of 1025 suppliers worldwide in Taiwan, China, Hong Kong, Japan, South Korea, Malaysia, Singapore, Vietnam, Philippines and other Asian countries, as well as America (such as the United States, Mexico, etc.), Europe (Belgium, France, Poland, Germany, the United Kingdom, Switzerland, the Czech Republic, etc.), Australia(New Zealand) and Africa (Seychelles) and other regions.
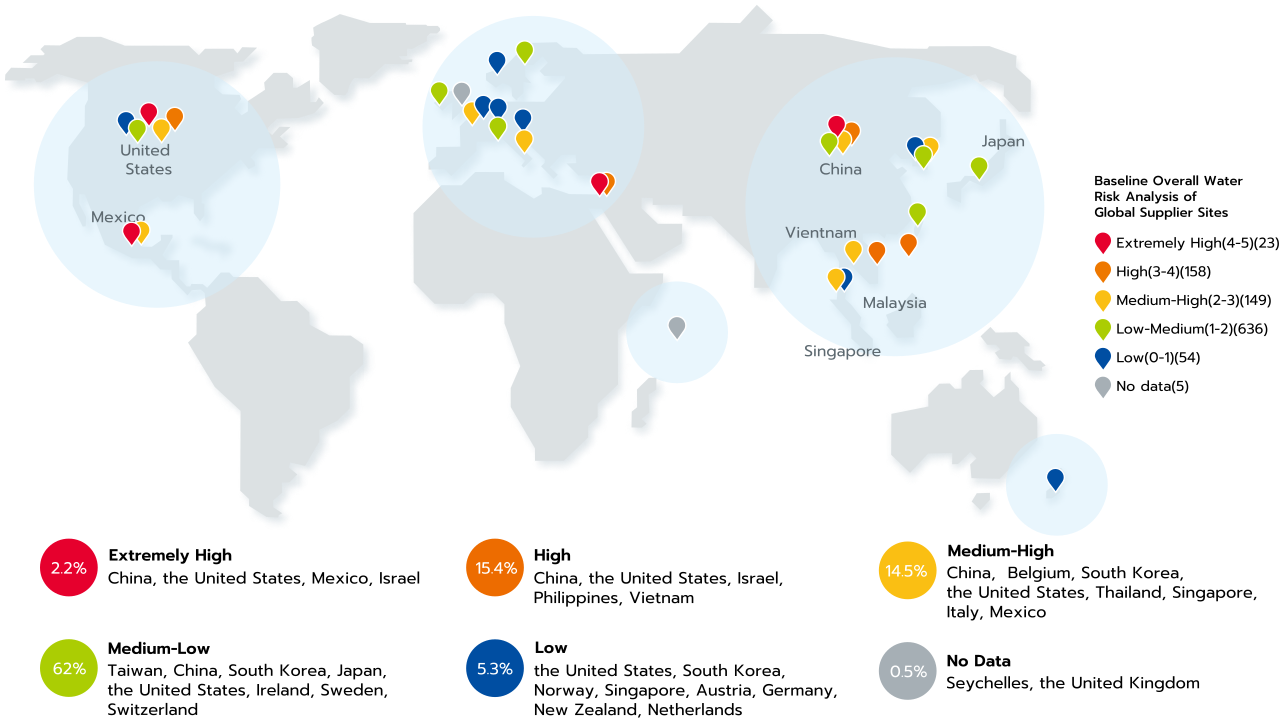
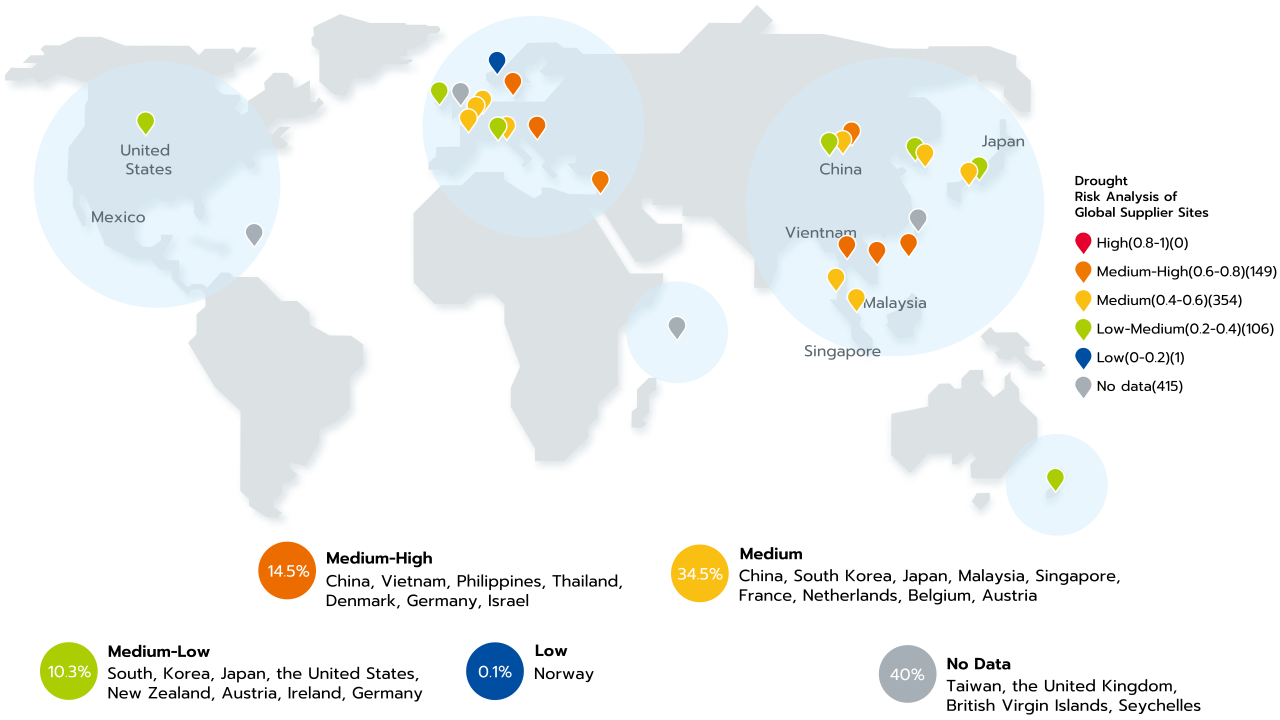
For the drought risk assessment, ASEH analyzed a total of 1025 suppliers using a composite indicator that integrates the likelihood of drought occurrence, the exposure of populations and assets, and the vulnerability of those populations and assets to the adverse impacts of drought.
Physical Risk Analysis of Taiwan Supplier Sites
The analysis covered 411 supplier sites located in Taiwan as the primary assessment scope, evaluating potential climate risks based on flood, landslide, and debris flow hazards at each supplier’s location.
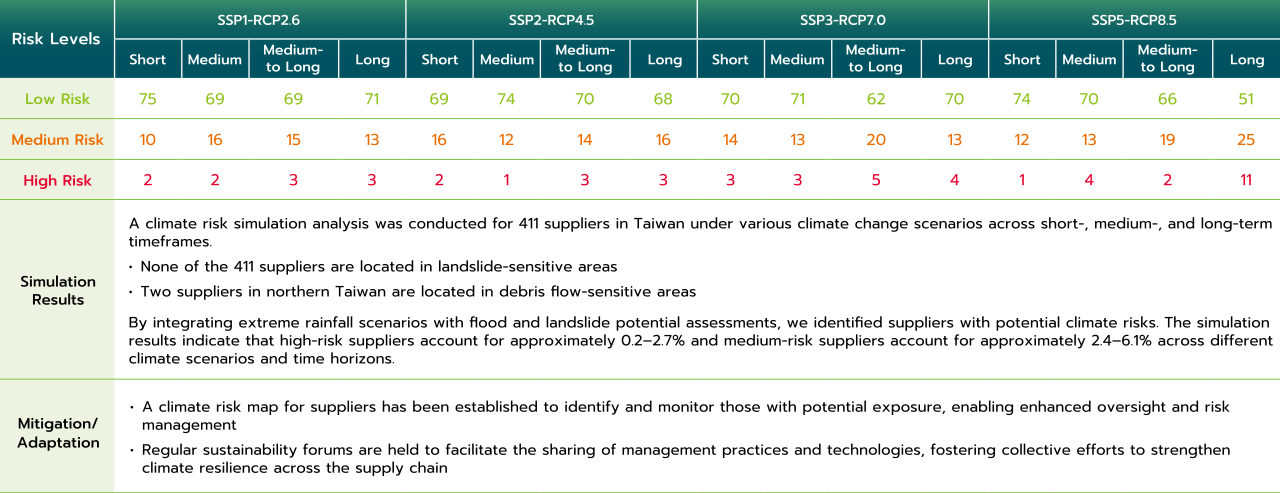
The assessment was performed based on the frequency of extreme heat episodes and cumulative risk scores associated with 411 suppliers’ locations.
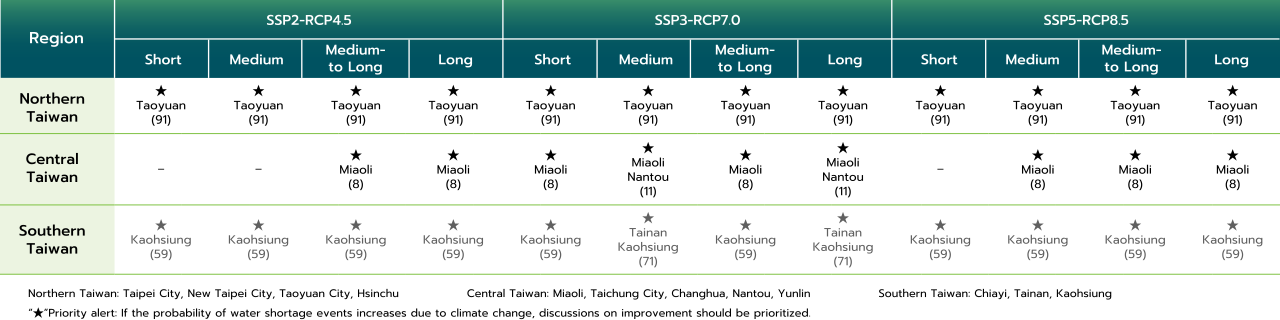
Based on the locations of Taiwanese supplier sites within the water supply areas of various reservoirs, we referenced historical data of water shortages at different reservoirs, and projected the probability of water shortages under the climate change scenario to assign different levels of attention (maintain, monitor, priority monitoring) to supplier sites in each region, using the water shortage risk matrix as illustrated below. Selected suppliers must consistently enhance water resource efficiency, expand water storage facilities, and establish emergency backup water sources. This will improve operational resilience in various situations and prevent disruptions to company operations in the event of a disaster. We will continue to monitor the other suppliers and adjust our level of attention where necessary, in order to effectively manage the risk of water shortage.
Risk Alert Level for Supplier Water Shortage
Other topics
Other topics
